02 · 2025
Customer Churn Prediction Pipeline
ML pipeline on 10,000+ e-commerce customers, from raw data to a live churn scoring tool
Role
Solo ML Engineer
Year
2025
Stack
Note: First load may take ~15s — ML model warms up on cold start.
01
Overview
A useful churn model can't stop at accuracy. It has to surface the drivers a manager can actually act on and translate predictions into a targeting strategy that fits how the business operates.
Working across two datasets - a 10,000+ record e-commerce churn dataset and the UCI Online Retail transaction log - I built a full pipeline: ETL, RFM feature engineering, model training, evaluation, and finally a live web tool (Churnalyze) so the predictions could be used without touching code.
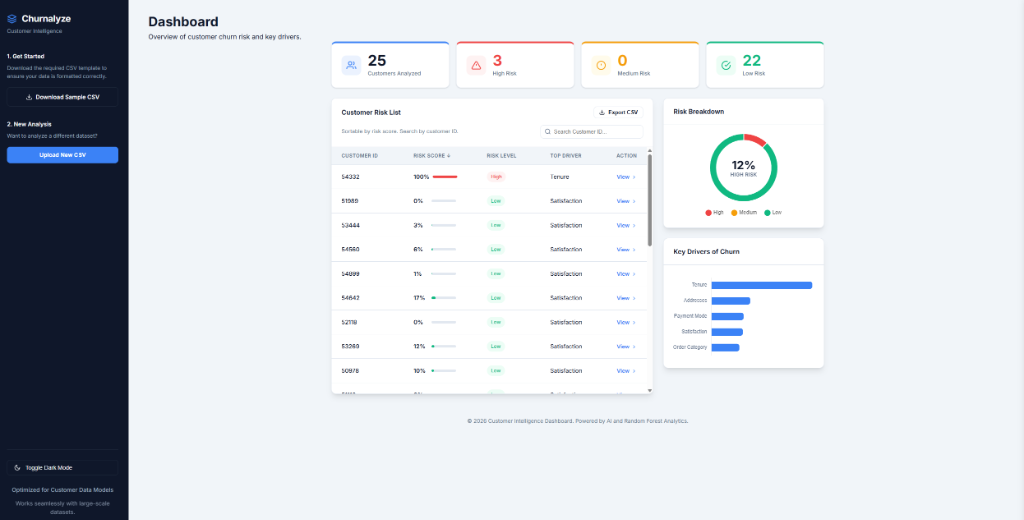
Churnalyze — the live web tool built from this project's trained Random Forest model
02
The Problem
E-commerce teams lose revenue to churn they can see in hindsight but rarely predict in time. I wanted to take historical behavioral signals - tenure, spend, satisfaction, complaint history - and turn them into risk scores a retention team could actually use, without needing to know any code.
02b
Model Performance
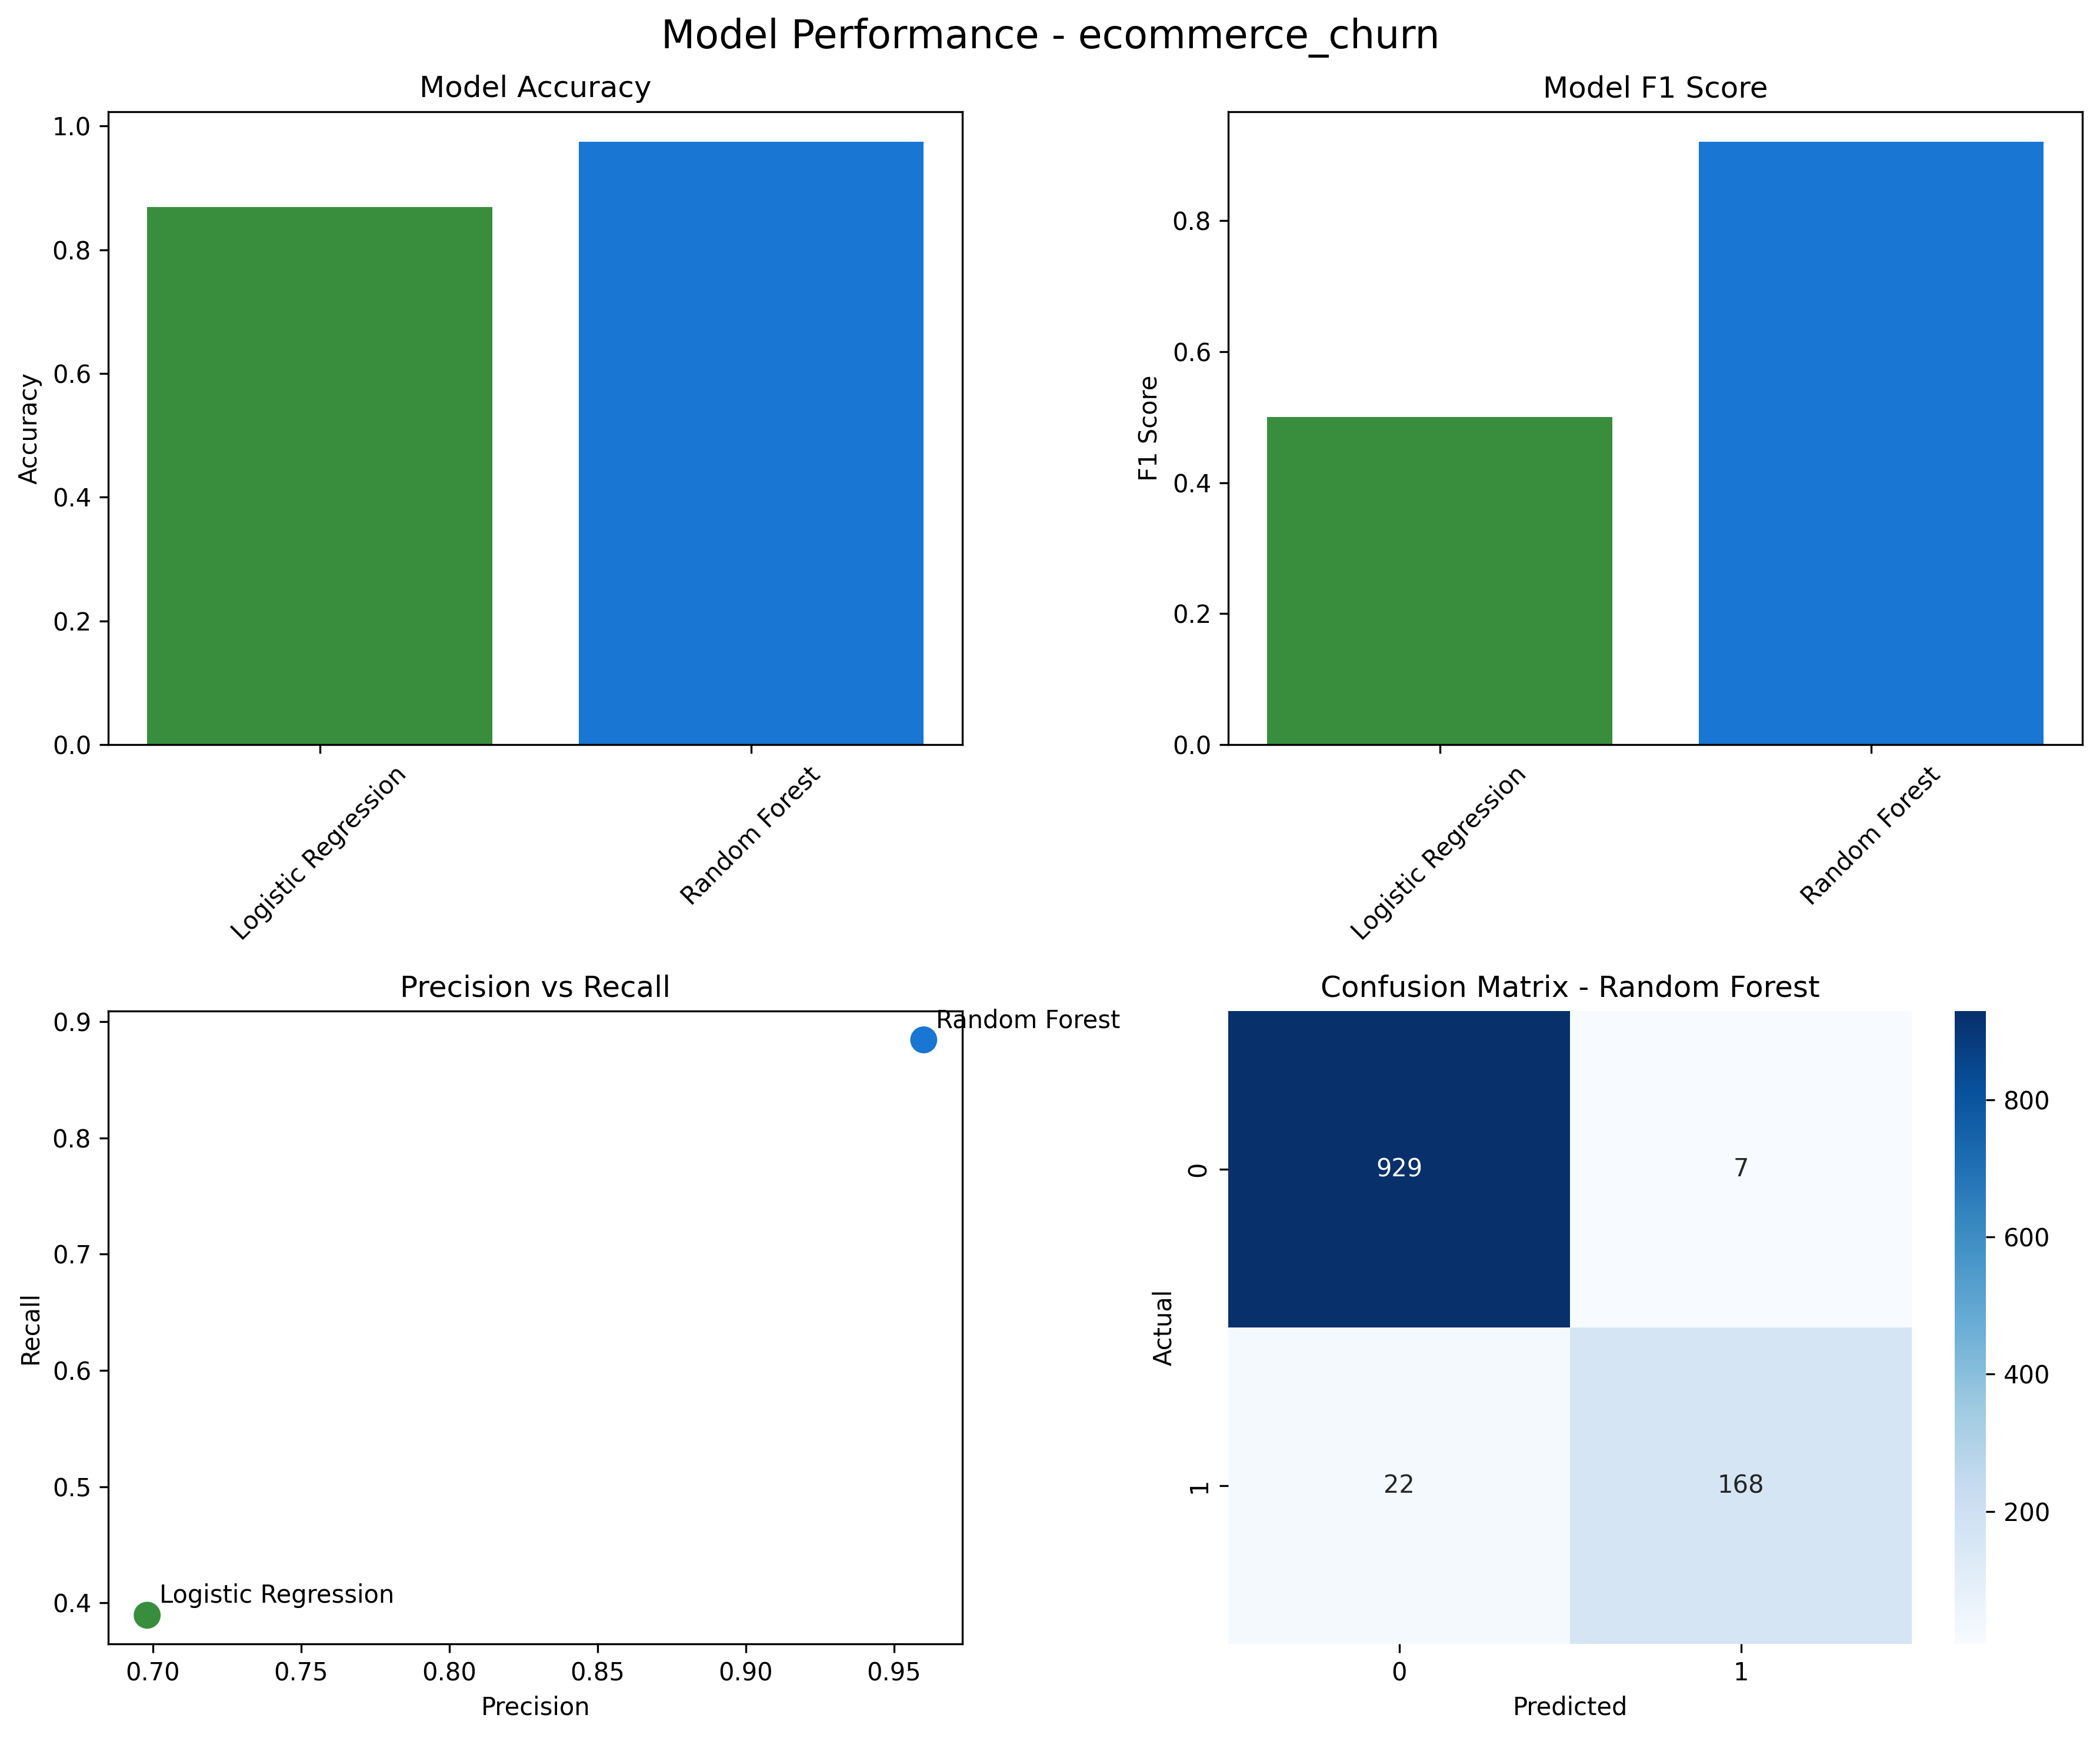
97.4%
Accuracy
Random Forest · E-Commerce
99.5%
ROC-AUC
Random Forest · E-Commerce
92.1%
F1-Score
Churn class · E-Commerce
10K+
Records
customers modeled
03
My Role
Data Engineering & ETL
Extracted raw Excel sources, built RFM (Recency, Frequency, Monetary) features, and created clean training-ready datasets across two independent datasets.
ML Modeling
Trained and evaluated Logistic Regression vs. Random Forest with class-balanced splits. Random Forest achieved 97.4% accuracy and 99.5% ROC-AUC on the e-commerce dataset.
Product & Deployment
Built Churnalyze — a FastAPI web app backed by the trained model that accepts a CSV upload and returns per-customer risk scores, key drivers, and a risk-tier breakdown.
05
The Process
Stage 01
Extract
Ingested two raw Excel sources: e-commerce churn labels and UCI transaction logs with 500K+ rows.
Stage 02
Feature Engineering
Constructed RFM scores, encoded categorical variables, and filled/scaled numerics for model-ready inputs.
Stage 03
Model & Evaluate
Compared Logistic Regression and Random Forest; Random Forest hit 97.4% accuracy and 99.5% ROC-AUC.
Stage 04
Deploy
Shipped Churnalyze: a FastAPI + Random Forest web tool that scores any customer CSV in real time.
06
Business Impact
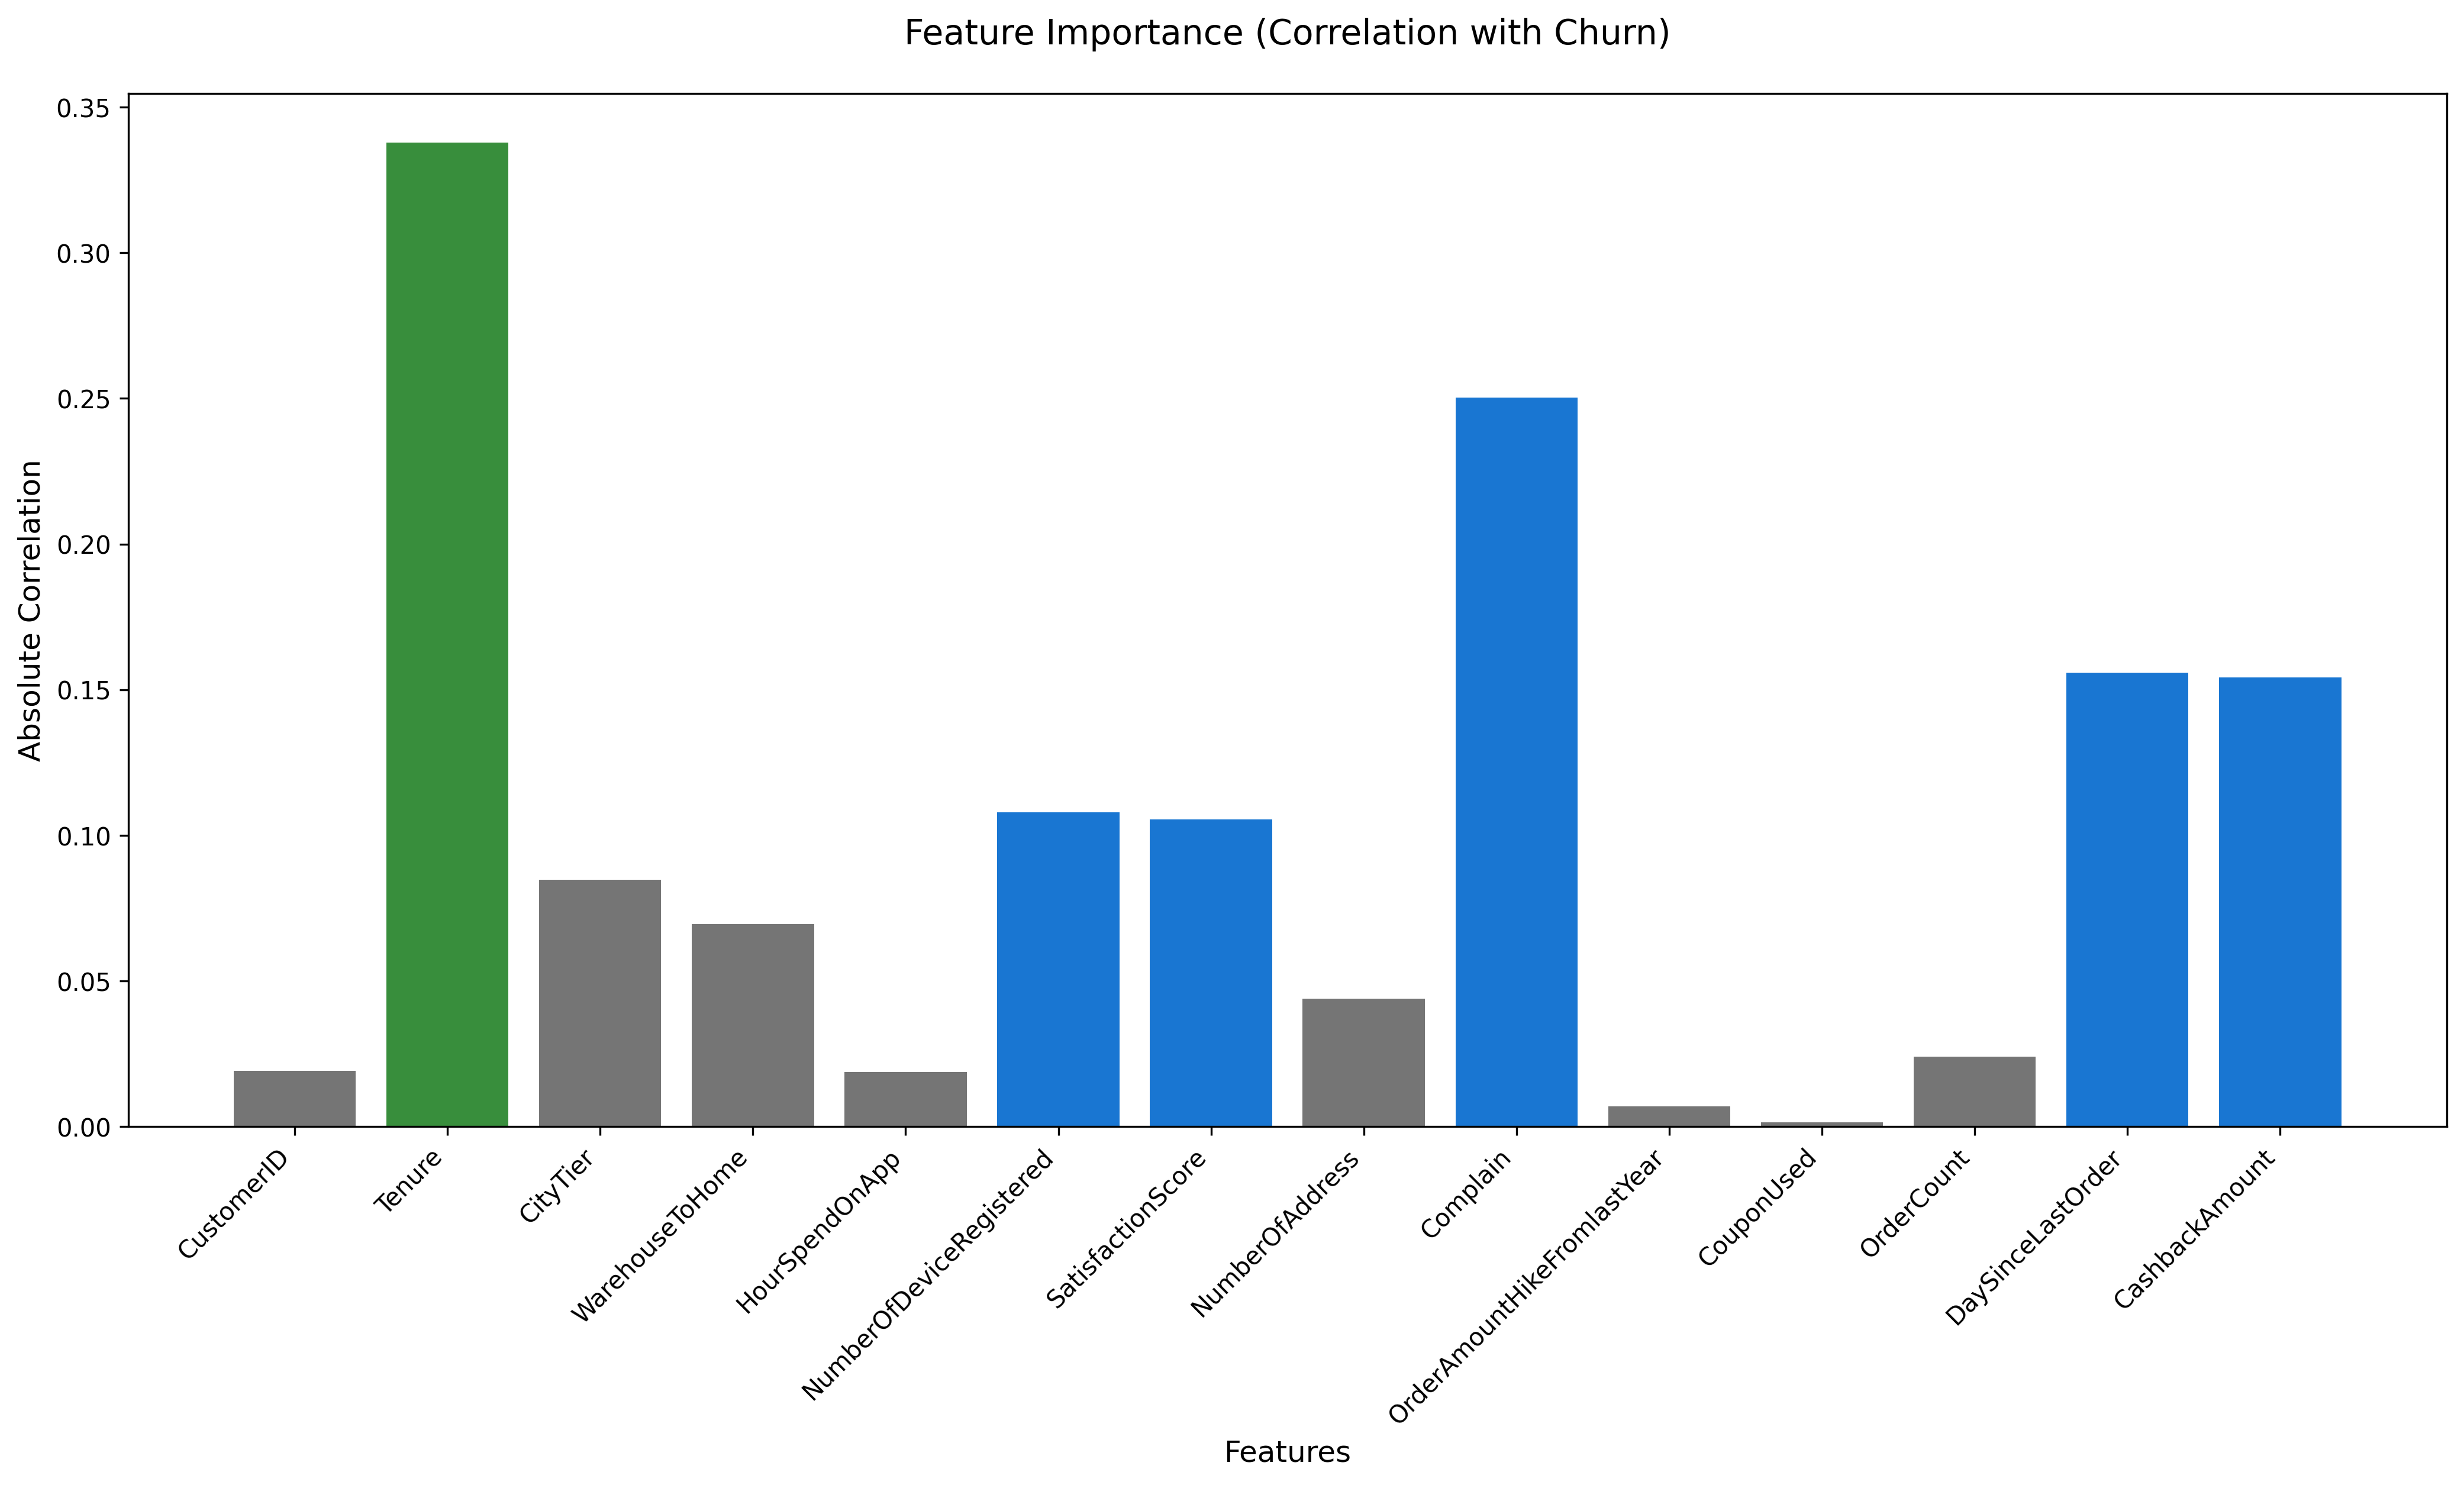
Identified the top 4 churn drivers by feature importance: Tenure, Satisfaction Score, Payment Mode, and Order Category.
Enabled non-technical retention teams to score any customer CSV without writing a line of code.
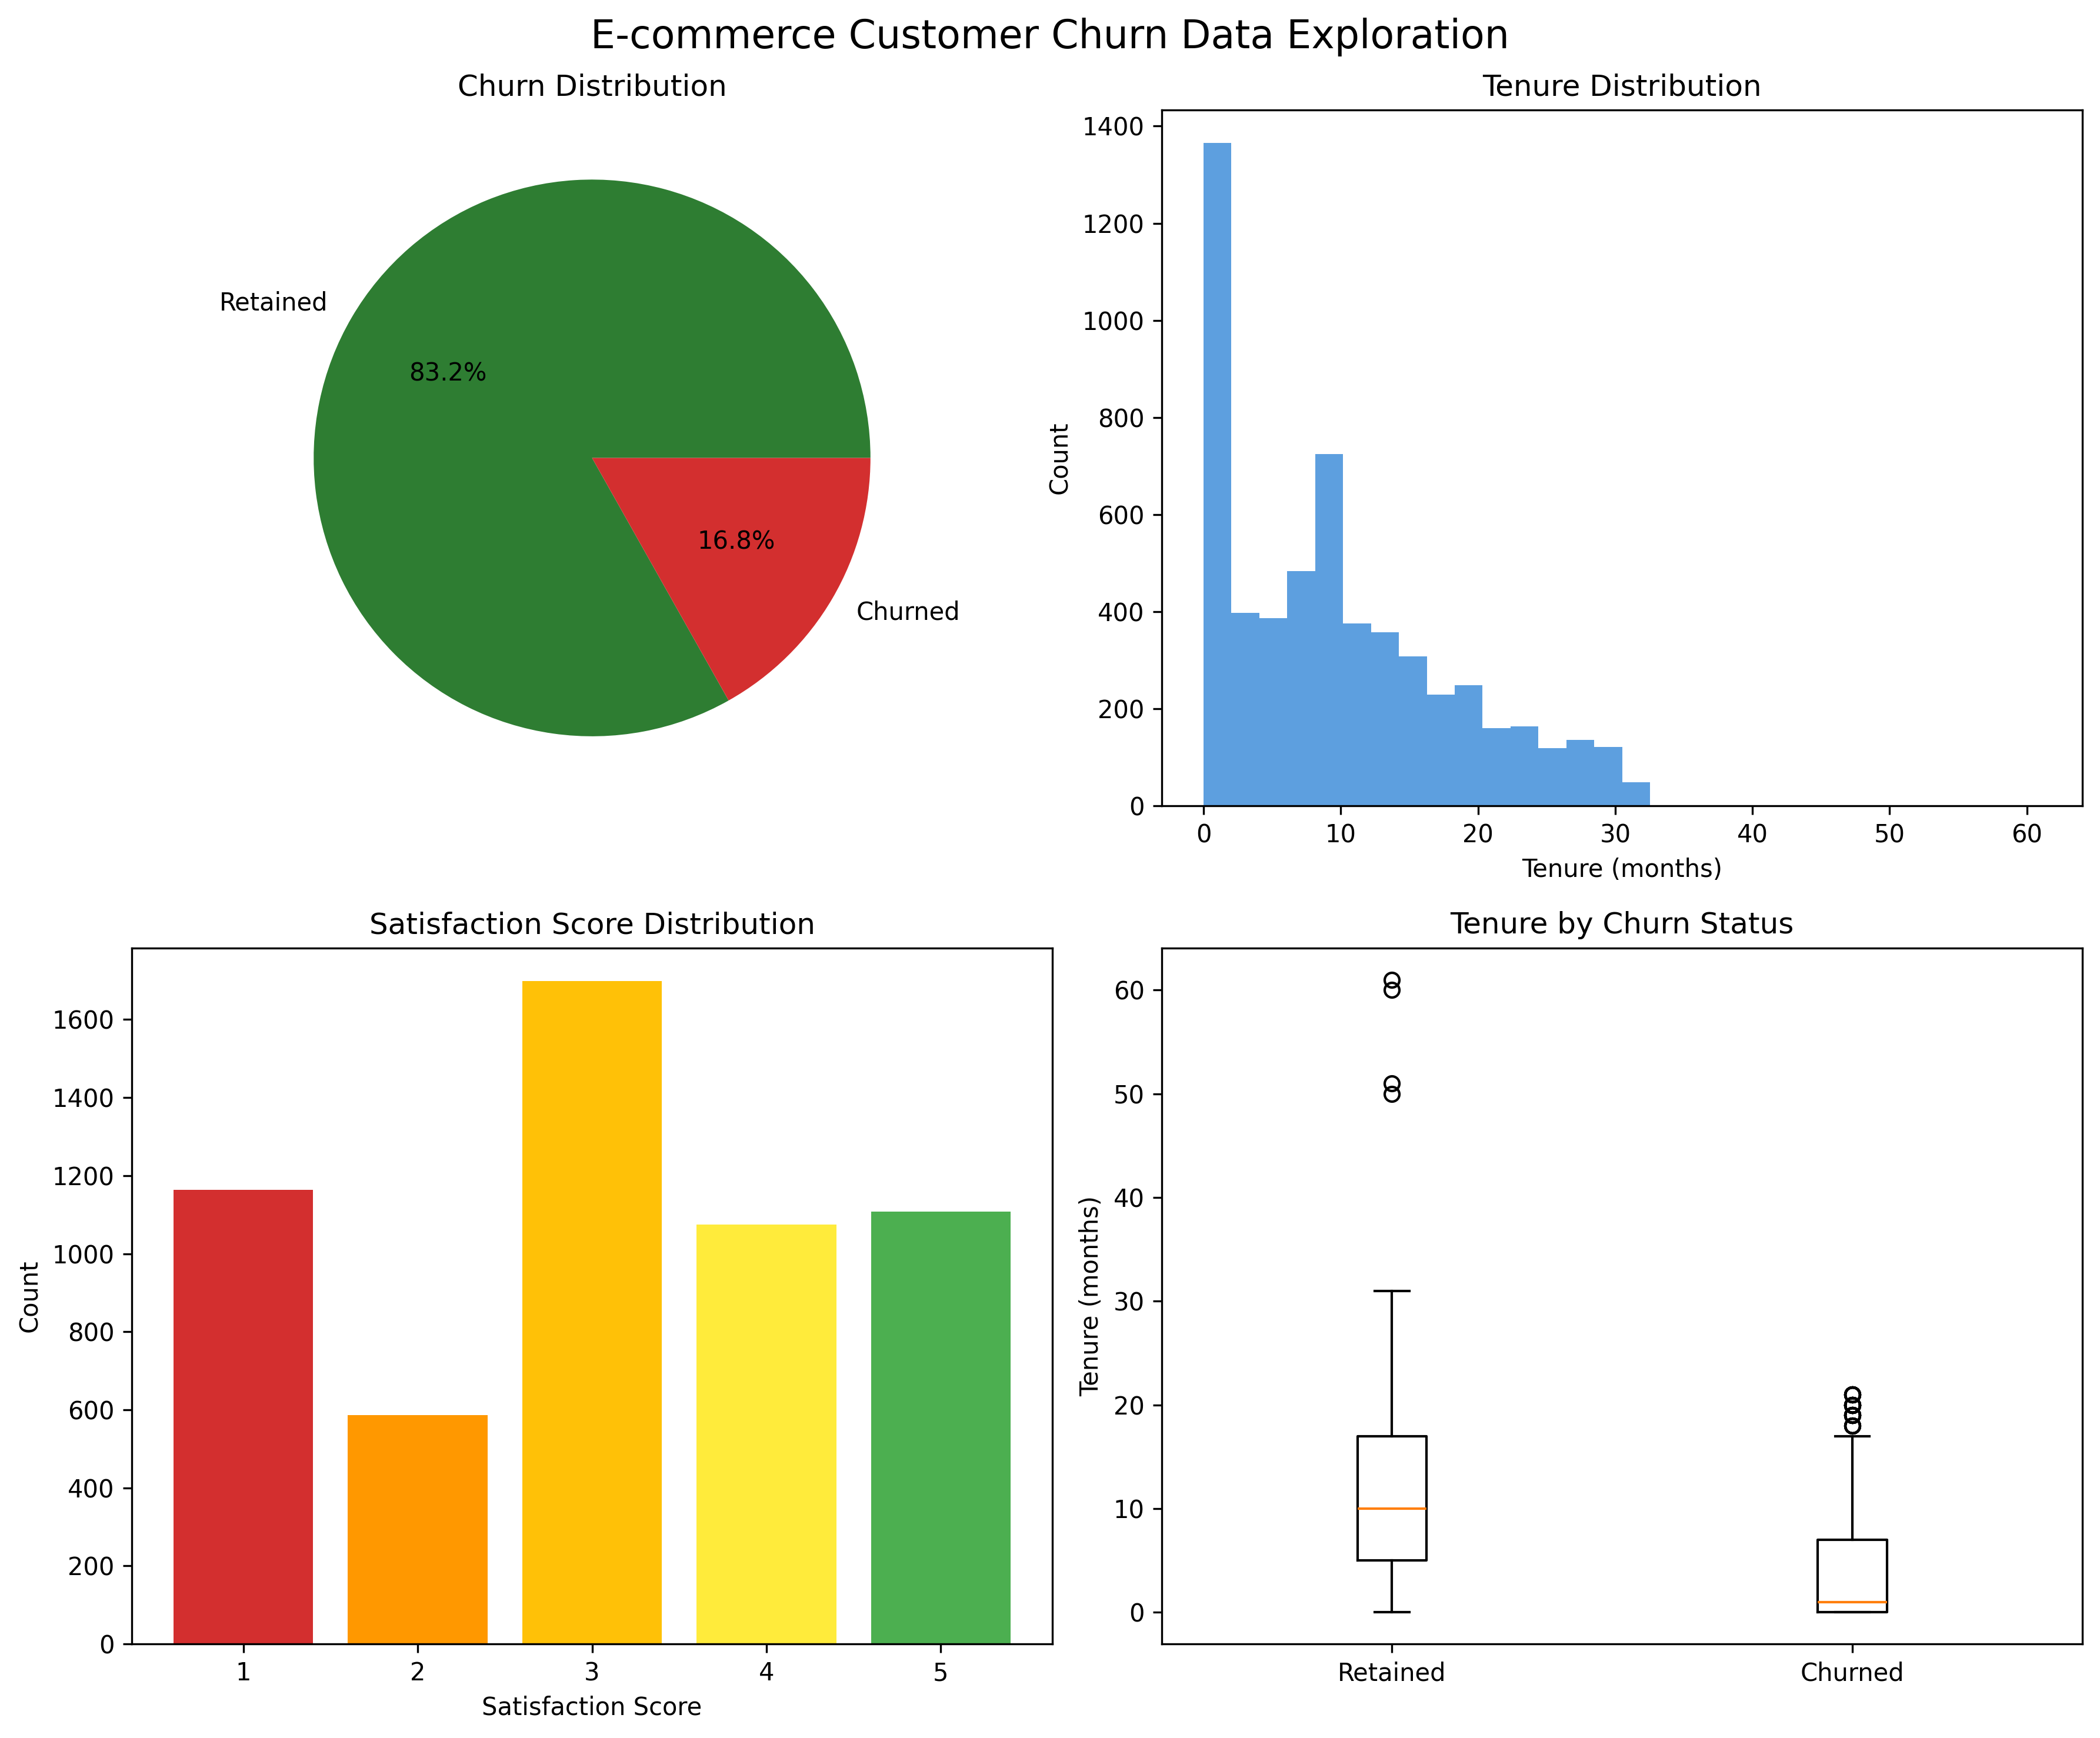
Inactive high-value customers — quiet on dashboards but expensive to lose — emerged as the highest-risk segment.
07
Key Highlights
Random Forest achieved near-perfect scores on the UCI dataset (100% accuracy, 1.0 ROC-AUC) — validating the ETL pipeline quality.
Churnalyze handles column remapping on upload, so it works with real-world CSV exports even when column names differ.
Retention recommendations were grounded in model feature importance, not intuition — keeping outputs actionable.
08
Project Presentation
Final Project Deck
Open in Google Drive ↗08
Visuals
Slide 1 of 3
09
Reflection
The most at-risk segment turned out to be inactive high-value customers - the ones quiet enough to look fine on a dashboard but expensive to lose. Reframing churn as 'silent value leaving' changed how the recommendations landed.”