01 · 2025
Big Red M Consulting
Salesforce ETL Pipelines and Tableau Dashboards for a Nonprofit Consulting Firm
Role
Data Engineer & Analytics Lead
Year
2025
Stack
01
Overview
Partnered with a nonprofit consulting firm to turn raw Salesforce exports into reliable, self-service analytics. I led the data engineering and dashboarding tracks: building Python/SQL ETL pipelines, modeling the data for analysis, and delivering executive-ready Tableau dashboards. The project concluded with formal client acceptance and handoff.
*Note: Portfolio visuals use anonymized or synthetic values; no raw client data published.*
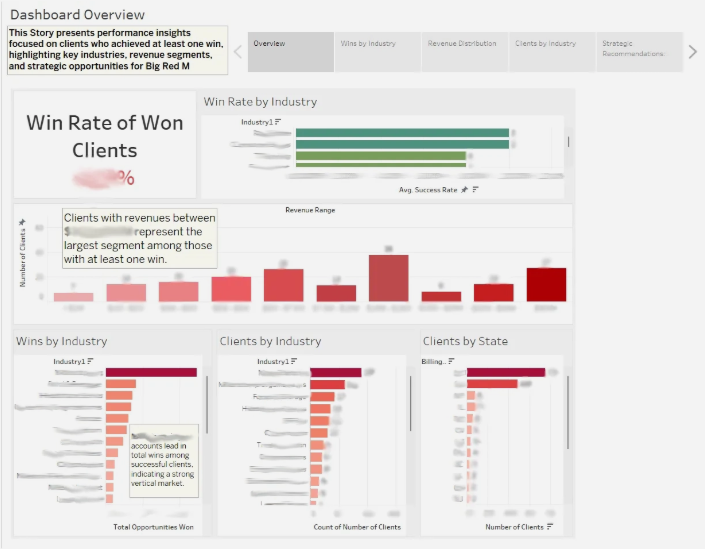
Dashboard overview - client data anonymized
02
The Problem
Leadership had no reliable way to see who their best clients were, where wins were coming from, or how performance was trending. Data was spread across separate sheets with inconsistent fields and duplicates, so weekly reporting took hours and the numbers were always in question.
03
My Role
Data Engineering
Built ETL to standardize, dedupe, and reconcile Accounts ↔ Opportunities ↔ Wins; enforced consistent types and cleaned categorical values.
Analytics & Modeling
Defined core KPIs (win rate, bookings, velocity), segmentation rules (by industry and client size), and created analysis-ready tables.
Visualization
Designed and shipped a 4-dashboard Tableau suite with filters and drill-downs for leaders and account teams.
PM & Stakeholders
Ran biweekly client reviews, maintained a Gantt plan, and drove scope alignment through delivery and sign-off.
04
Data Strategy
| Field | Type | Description | Example |
|---|---|---|---|
| Account Name | Text | Unique client/company name | Acme Corp |
| Industry | Categorical | Sector classification | Healthcare |
| Employees | Integer | Number of employees reported | 350 |
| Opportunity Stage | Category | Pipeline stage (e.g., Open, Won) | Closed Won |
| Close Date | Date | Date opportunity was closed | 2025-05-12 |
05
The Process
Stage 01
Extract
Automated ingestion of raw Salesforce CSV/Excel exports covering Accounts, Opportunities, and Wins.
Stage 02
Transform
Python-based cleaning: normalized revenue fields, deduped records, and harmonized industry taxonomies.
Stage 03
Model
Engineered a star-schema in SQL to reconcile disparate data sources into unified analytics-ready tables.
Stage 04
Deliver
Shipped executive Tableau dashboards with automated KPI tracking and drill-down capabilities.
06
Business Impact
Faster reporting: Automated ETL replaced manual weekly Excel prep; teams now pull metrics on demand.
Higher confidence: Standardized fields and deduped accounts eliminated conflicting numbers across teams.
Actionable focus: Clear ICP-oriented segmentation (industry/size) guided outreach and planning.
07
Key Highlights
Reconciled 'wins' across three perspectives (Accounts, Opportunities, Wins-only) to a single truth.
Built guardrails so KPI tiles can't compute on dirty or partial refreshes.
Designed dashboards for both exec snapshots and analyst drill-downs—no separate builds required.
09
Reflection
The biggest unlock wasn't just the tech - it was the reconciliation. By proving the numbers matched across three different legacy views (Accounts, Opps, and Wins), I gave leadership the confidence to stop debating the data and start making decisions.”